React DevTools changelog
4.27.2
February 16, 2023
- Replace DevTools
semverusages withcompare-versionsfor smaller bundle size (markerikson in #26122) - Support highlights for React Native apps in dev tools (ryancat in #26060)
- improve error handling in extension (mondaychen in #26068)
4.27.1
December 6, 2022
- [bug fix] revert values in ReactFiberFlags to keep consistency for devtools (mondaychen in #25832)
4.27.0
November 28, 2022
Features
- add support for new host type fibers for server components use cases (mondaychen in #25616)
- [react devtools] Device storage support (rbalicki2 in #25452)
- upgrade to Manifest V3 (mondaychen in #25145)
Bugfixes
- bug fix for Hydrating fibers (mondaychen in #25663)
4.26.1
October 13, 2022
4.26.0
September 16, 2022
- Show DevTools icons in Edge browser panel (itskolli in #25257)
- [Bugfix] Don't hide fragment if it has a key (lunaruan in #25197)
- Handle info, group, and groupCollapsed in Strict Mode logging (timneutkens in #25172)
- Highlight RN elements on hover (tyao1 in #25106)
- Remove ForwardRef/Memo from display name if
displayNameis set (eps1lon in #21952)
4.25.0
July 13, 2022
- Timeline Profiler Sidebar with component tree (lunaruan and blakef in #24816, #24815, #24814, #24805, #24776)
- [DevTools][Bugfix] Fix DevTools Perf Issue When Unmounting Large React Subtrees (lunaruan in #24863)
- Enable "reload & profile" button for timeline view (mondaychen in #24702)
- Find best renderer when inspecting app with mutilple react roots (mondaychen in #24665)
- Only polyfill requestAnimationFrame when necessary (mondaychen in #24651)
4.24.7
May 31, 2022
- mock requestAnimationFrame with setTimeout as a temporary fix for #24626 (mondaychen in #24633)
- Fix formatWithStyles not styling the results if the first argument is an object + Added unit tests (lunaruan in #24554)
4.24.6
May 12, 2022
- fix a bug in console.log with non-string args (mondaychen in #24546)
- Add Pragma to Only Run Tests if Version Requirement Satisfied (lunaruan in #24533)
- [DevTools][Bug] Fix Race Condition When Unmounting Fibers (lunaruan in #24510)
- [React DevTools] Improve DevTools UI when Inspecting a user Component that Throws an Error (mondaychen in #24248)
4.24.5
May 5, 2022
- Fixed potential undefined error in
TreeContextreducer (bvaughn in #24501) - Fix error where Profiler sometimes incorrectlyed reported that a
forwardRefdid not render (lunaruan in #24494) - Fix regex for
formateWithStylesfunction (lunaruan in #24486) - Fixed wrong method call for LRU cache (bvaughn in #24477)
- Synchronize implementations of second render logging (billyjanitsch in #24381)
- Don't stringify objects for console log second render (lunaruan in #24373)
4.24.4
April 8, 2022
- Allow react-devtools-inline
createStore()method to override Store config params (bvaughn in #24303) - [ReactDebugTools] wrap uncaught error from rendering user's component (mondaychen in #24216)
4.24.3
March 29, 2022
Bugfix
- Profiler should only report stateful hooks that change between renders (bvaughn in #24189)
- Ignore duplicate welcome "message" events (bvaughn in #24186)
- Attach DevTools Tree keyboard events to the Tree container (not the document) (bvaughn in #24164)
4.24.2
March 24, 2022
Bugfix
- Show upgrade/downgrade instructions inline for errors thrown by the Store due to incompatible protocol (mismatched backend and frontend versions) (bvaughn in #24147)
- Inspecting an element in a nested renderer no longer throws (lunaruan in #24116)
4.24.1
March 15, 2022
Bugfix
- Disable unsupported Bridge protocol version dialog and add workaround for old protocol operations format (bvaughn in #24093)
4.24.0
March 10, 2022
Feature
- Show DevTools backend and frontend versions in UI (bvaughn in #23399)
- Timeline profiler refactored to support reading basic profiling data directly from React (bvaughn in #22529)
Bugfix
- Better handle undefined
Errorstacks in DevTools error boundary (bvaughn in #24065) - Fixed edge case bug in Profiler commit filtering (bvaughn in #24031)
- Gracefully handle empty "xstyle" prop values (lunaruan in #23279 and bvaughn in #23190)
- Add
<TracingMarker>component boilerplate (lunaruan in #23275)
Misc
- Remove object-assign polyfill (sebmarkbage in #23351)
Breaking change
- Move createRoot/hydrateRoot to react-dom/client (sebmarkbage in #23385).
Technically this is a breaking change for projects using react-devtools-inline, but since this package already depends on the experimental release channel, we are going to include it in 4.24.
4.23.0
January 24, 2022
Feature
Bugfix
- Don't crawl unmounted subtrees when profiling starts (bvaughn in #23162)
- Filter deleted components from the updaters list to avoid runtime errors later (lunaruan in #23156)
Misc
4.22.1
December 14, 2021
- Fix invalid
require()statements inreact-devtools-inline(bvaughn in #22961) - Fix invalid
filesarray inreact-devtoolspackage.json(bvaughn in #22960)
4.22.0
December 13, 2021
A note for React Native users
React DevTools has two main pieces:
- The frontend users interact with (the Components tree, the Profiler, etc.).
- The backend which runs in the same context as React itself. (In the web page with React DOM or shipped on the device with the React Native runtime.)
This release updates the protocol that DevTools uses to communicate between the "frontend" and "backend" components.
Because React Native embeds a copy of the React DevTools "backend" (react-devtools-core/backend), the "frontend" (UI) needs to match. This means you may be prompted to upgrade (or downgrade) your React DevTools based on which version of React Native your app uses.
Features
- Support multiple DevTools instances per page (@bvaughn in #22949)
- Advocate for StrictMode usage within Components tree (@bvaughn in #22886)
- StyleX plug-in for resolving atomic styles to values for props.xstyle (@bvaughn in #22808)
- Timeline search (@bvaughn in #22799)
- Timeline: Improved snapshot view (@bvaughn in #22706)
- Display root type for root updates in "what caused this update?" (@eps1lon in #22599)
Bugfix
- DevTools should inject itself for XHTML pages too (not just HTML) (@bvaughn in #22932)
- Don't restore profiling data if we're profling (@eps1lon in #22753)
- DevTools should properly report re-renders due to (use)context changes (@bvaughn in #22746)
- Filter empty commits (all Fibers bailed out) from Profiler (@bvaughn in #22745)
- Accept json file in import fileinput (@jyash97 in #22717)
- Expose css vars to reach-ui portal components (@jyash97 in #22716)
- Fix DevTools advanced tooltip display conditional check (@bvaughn in #22669)
Misc
4.21.0
October 31, 2021
Features
- Scheduling Profiler: Add marks for component effects (mount and unmount) (@bvaughn in #22578)
- Scheduling Profiler: De-emphasize React internal frames (bvaughn in #22588)
Bugfix
- Revert logic for checking for duplicate installations of DevTools potentially causing issues loading Components tab (@jstejada in #22638)
- Scheduling Profiler does not warn about long transitions (@bvaughn in #22614)
- Re-enable 'Reload and Start Profiling' for Microsoft Edge (@eoandersson in #22631)
Misc
- DevTools supports ENV-injected version for better internal bug reports (@bvaughn in #22635)
- Fix typos (@KonstHardy in #22494)
4.20.2
October 20, 2021
Bugfix
- Dev Tools: Relax constraint on passing extensionId for backend init (@jstejada in #22597)
- DevTools: Fix passing extensionId in evaled postMessage calls (@jstejada in #22590)
4.20.1
October 19, 2021
Bugfix
- Only show DevTools warning about unrecognized build in Chrome (@jstejada in #22571)
- DevTools: Include Edge in browser name detection (@jstejada in #22584)
4.20.0
October 15, 2021
Features
- Allow to use the Profiler when no client is connected in standalone DevTools (@gabrieltrompiz in #22551)
Bugfix
- Surface backend errors during inspection in the frontend UI (@bvaughn in #22546)
- Prevent splash page in standalone app from becoming unresponsive after the disconnection of a client (#22558) (@gabrieltrompiz in #22560)
- Prevent errors/crashing when multiple installs of DevTools are present (@jstejada in #22517)
- Update Fiber logic in backend renderer to match implementation in React (@jstejada in #22527)
Misc
- Show warning in UI when duplicate installations of DevTools extension are detected (@jstejada in #22563)
- Improved filenames of built worker files (@akgupta0777 in #22559)
4.19.2
October 8, 2021
Bugfix
- Show different error boundary UI for timeouts than normal errors (bvaughn in #22483)
- Fixed bug where deleting a component filter would also close the settings modal (Biki-das in #22484)
4.19.1
October 1, 2021
Bugfix
4.19.0
September 29, 2021
Features
- Scheduling Profiler: Show Suspense resource .displayName (bvaughn in #22451)
- Scheduling Profiler marks should include thrown Errors (bvaughn in #22419)
- Don't patch console during first render in strict mode (lunaruan in #22308)
- Show which hook indices changed when profiling for all builds (bvaughn in #22365)
- Display actual ReactDOM API name in root type (eps1lon in #22363)
- Add named hooks support to standalone and inline DevTools (jstejada in #22320 and bvaughn in #22263)
Bugfix
- DevTools encoding supports multibyte characters (e.g. "🟩") (bvaughn in #22424)
- Improve DEV errors if string coercion throws (Temporal.*, Symbol, etc.) (justingrant in #22064)
- Fix memory leak caused by not storing alternate Fiber pointer (bvaughn in #22346)
- Fix call stack exceeded error in
utfDecodeString()(bvaughn in #22330) - Fix runtime error when inspecting an element times out (jstejada in #22329)
Performance
- DevTools: Lazily parse indexed map sections (bvaughn in #22415)
- DevTools: Hook names optimizations (bvaughn in #22403)
- Replaced
network.onRequestFinished()caching withnetwork.getHAR()(bvaughn in #22285)
4.18.0
September 1, 2021
Features
- DevTools: Improve named hooks network caching (bvaughn in #22198)
- Console Logging for StrictMode Double Rendering (lunaruan in #22030)
Bugfix
- Fix react-devtools-inline size issues (lunaruan in #22232)
- devtools: Don't display hook index of useContext (eps1lon in #22200)
- Throw error in console without interfering with logs (lunaruan in #22175)
4.17.0
August 24, 2021
Features
- Scheduling Profiler: Add network measures (bvaughn in #22112)
- Add options for disabling some features (hbenl in #22136)
Bugfix
- Fixed broken scroll-to error or warning feature (bvaughn and eps1lon in #22147 and #22144)
- Replaced WeakMap with LRU for inspected element cache (bvaughn in #22160)
- Add more detailed error handling if profiling data does not have any React marks (byronluk in #22157)
- Various named hooks bug fixes (jstejada in #22129, #22128, #22096, and #22148)
- Fix tooltip wheel event regression (bvaughn in #22130)
- Replace
source-maplibrary withsource-map-jsfor named hooks source map parsing (bvaughn in #22126)
4.16.0
August 16, 2021
Features
Bugfix
- split parsing code to unblock Firefox release (lunaruan in #22102)
- Scheduling profiler: Canvas views clip by default (bvaughn in #22100)
- Fixed Components tree indentation bug for Chrome extension (bvaughn in #22083)
4.15.0
August 11, 2021
Features
- Added new scheduling profiler tool (bvaughn, kartikcho, and taneliang in #22006, #21990, #22013, #21897, #22029, #22038, #22043, #21947, #21966, #21970, #21971, #21975).
- Parsing source code for extracting names for hooks now happens in a worker (tsirlucas in #21902).
- Format hyperlink text as a clickable link (kkragoth in #21964).
- Named hooks can now be extracted from extended source maps (jstejada #22010, #22073).
- Hook indices now show up as a reason why a component rendered in the profiler (mrkev in #22073).
- Optimize images in DevTools (ilhamsyahids in #21968).
Bugfix
- Named hooks cache is correctly cleared after Fast Refresh (bvaughn in #21891).
- Hook names are correctly extracted when parsing nested hook calls (jstejada in #22037, #21996).
- Highlight updates with memoized components (Selnapenek in #22008).
- Set app icon on MacOS (christian-schulze in #21908).
- Updated @reach packages to fix unmount bug (bvaughn in #22075).
Misc
- Refactor imperative theme code (houssemchebeb in #21950).
- Change some remaining instances of master -> main (shubham9411 in #21982).
Scheduling profiler
What is React working on?
React’s previous Profiler primarily reports how fast (or slow) components are when rendering. It didn’t provide an overview of what React is doing (the actual cooperative scheduling bits). The new profiler does. It shows when components schedule state updates and when React works on them. It also shows how React categorizes and prioritizing what it works on.
Here’s a profile for a simple app that uses only the legacy (synchronous) ReactDOM.render API. The profiler shows that all of the work scheduled and rendered by this app is done at synchronous priority:
https://user-images.githubusercontent.com/29597/129042321-56985f5a-264e-4f3a-a8b7-9371d75c690f.mp4
Here’s a more interesting profile for an app that’s rendered at default priority using the new createRoot API, then updates synchronously in response to an “input” event to manage a "controlled component":
https://user-images.githubusercontent.com/29597/129074959-50912a63-0215-4be5-b51b-1e0004fcd2a1.mp4
Here’s part of a profile showing an idle app (no JavaScript running). In this case, React does some pre-rendering work for components that are “offscreen” (not currently displayed).
https://user-images.githubusercontent.com/29597/128971757-612f232f-c64f-4447-a766-66a0516e8f49.mp4
Note that “offscreen” refers to a new API and set of features that we haven’t talked about much yet except for some passing references. We’ll talk more about it in future posts.
What are “transitions” and how do they work?
We recently shared an update about the new startTransition API. This API helps apps feel responsive even when there are large updates by splitting the work into (1) a quick update to show that the app has received some input and (2) a slower update (the “transition”) that actually does any heavy lifting needed as a result of the input.
Here is an example profile that uses the transition API. First React renders a small update that shows the user some visual feedback (like updating a controlled component or showing an inline loading indicator). Then it renders a larger update that, in this case, computes some expensive value.
https://user-images.githubusercontent.com/29597/129079176-0995c8c0-e95a-4f44-8d55-891a7efa35c0.mp4
How does Suspense impact rendering performance?
You may have heard mention of “suspense” in past talks or seen it referenced in our docs. Although full support for data fetching via Suspense is expected to be released sometime after React 18.0, you can use Suspense today for things like lazy-loading React components. The new profiler shows when components suspend during render and how that impacts overall rendering performance.
Here’s an example profile that suspends during the initial render to lazy-load a component using React.lazy. While this component is loading, React shows a “fallback“ (placeholder UI). Once the component finishes loading, React retries the render and commits the final UI.
https://user-images.githubusercontent.com/29597/129054366-2700e7e8-0172-4f61-9453-475acd740456.mp4
We plan to expand support for Suspense in the coming weeks to more explicitly show when suspense fallbacks are rendered and which subsequent renders are related to an initial update that suspended.
What else might cause a render to get delayed?
Suspense can cause a render to get delayed as React waits for data to load, but React can also get stuck waiting on a lot of JavaScript to run.
React profiling tools have previously focused on only reporting what React (or React components) are doing, but any JavaScript the browser runs affects performance. The new profiler shows non-React JavaScript as well, making it easy to see when it delays React from rendering.
https://user-images.githubusercontent.com/29597/128971952-7c4e7e11-f4fb-497e-b643-4d9b3994b590.mp4
What can you do to improve performance?
Until now, DevTools (and the Profiler) has provided information without commentary. The new profiler takes a more active approach– highlighting where we think performance can be improved and providing suggestions.
For example, suspending during an update is generally a bad user experience because it causes previously shown components to be unmounted (hidden) so the fallback can be shown while data loads. This can be avoided using the new Transition API. If you forget to add a transition to an update that suspends, the new profiler will warn you about this:
https://user-images.githubusercontent.com/29597/128972228-3b23f01a-8017-43ad-b371-975ffed26c06.mp4
The new profiler also warns about scheduling a long, synchronous React update inside of event handler.
https://user-images.githubusercontent.com/29597/128972000-d7477ba3-b779-46f2-b141-aaa712e9d6d2.mp4
Another thing the new profiler will warn about is long-running renders scheduled from layout effects (useLayoutEffect or componentDidMount/componentDidUpdate). These updates (called “nested updates”) are sometimes necessary to adjust layout before the browser paints, but they should be fast. Slow nested updates make the browser feel unresponsive.
https://user-images.githubusercontent.com/29597/128972017-3ed0e682-751c-46fb-a6c5-271f255c8087.mp4
4.14.0
July 17, 2021
Features
- Display hook names for inspected components (saphal1998, VibhorCodecianGupta, bvaughn, and motiz88 in #21641, #21790, #21814, #21815, #21831, #21833, #21835, #21865, #21871, #21874, #21891)
- Control for manually toggling error boundaries (baopham in #21583)
- Allow user to manually enter Profiler commit number to jump between commits (srubin in #19957)
Display hook names for inspected components

Control for manually toggling error boundaries

4.13.5
May 25, 2021
Bugfix
- Handle edge case where a component mounts before its "owner" (in DEV mode) that previously caused a validation error (bvaughn in #21562)
4.13.4
May 20, 2021
Bugfix
- Fix edge-case Fast Refresh bug that caused Fibers with warnings/errors to be untracked prematurely (which broke componentinspection in DevTools) (bvaughn in #21536)
- Revert force deep re-mount when Fast Refresh detected (was no longer necessary) (bvaughn in #21539)
4.13.3
May 19, 2021
Misc
- Updated
reactandreact-domAPI imports in preparation for upcoming stable release (bvaughn in #21488)
Bugfix
- Reload all roots after Fast Refresh force-remount (to avoid corrupted Store state) (bvaughn in #21516 and #21523)
- Errors thrown by Store can be dismissed so DevTools remain usable in many cases (bvaughn in #21520)
- Bugfix for
useState()object withhasOwnPropertykey (bvaughn in #21524) - Fixed string concatenation problem when a
Symbolwas logged toconsole.errororconsole.warn(bvaughn in #21521) - DevTools: Fixed version range NPM syntax (bvaughn in 9cf1069)
- Tweaked DevTools error template title to match issue form template (bvaughn in 1a2d792)
4.13.2
May 7, 2021
Misc
- Improved bug report template to use new GitHub issue forms (bvaughn in #21450)
4.13.1
April 28, 2021
Bugfix
- Improve display name logic for
React.memocomponents (bvaughn in #21392) - Fixed potential runtime error with Suspense in versions <= 17 (bvaughn in #21432)
- Errors thrown in the Store are no longer silent (bvaughn in #21426)
Misc
4.13.0
April 28, 2021
Features
Bugfix
- DevTools iterates over siblings during mount (rather than recursing) to avoid stack overflow errors (bvaughn in #21377)
- Multiple error dialogs can be visible at once (bvaughn in #21370)
- Console patching should handle Symbols without erroring (bvaughn in #21368)
Bridge protocol version backend/frontend
During initialization, DevTools now checks to ensure it's compatible with the "backend" that's embedded within a renderer like React Native. If the two aren't compatible, upgrade instructions will be shown:
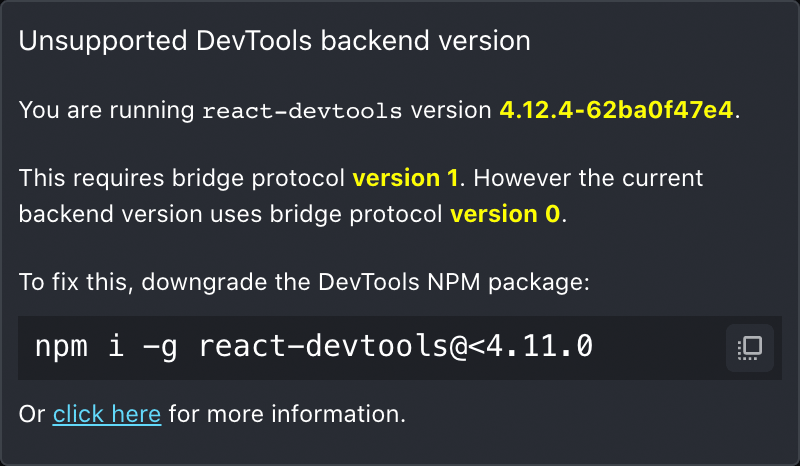

Learn more about this change at fb.me/devtools-unsupported-bridge-protocol
4.12.4
April 19, 2021
Bugfix
- Remove
@octokit/restdependency because of a problem with transitive dependencies (bvaughn in #21317)
4.12.3
April 19, 2021
Bugfix
- Wrapped quotation marks around Fiber ids or indices for all DevTools errors to better support GitHub fuzzy error search (bvaughn in #21314)
4.12.2
April 16, 2021
Bugfix
4.12.1
April 14, 2021
Although this release is being made for all NPM packages, only the react-devtools-inline package contains changes.
Bugfix
4.12.0
April 12, 2021
Although this release is being made for all NPM packages, only the react-devtools-inline package contains changes.
Features
- Added
createBridgeandcreateStoreexports to thereact-devtools-inline/frontendentrypoint to support advanced use cases (bvaughn in #21032)
4.11.1
April 11, 2021
Bugfix
4.11.0
April 9, 2021
Bugfix
$rshould contain hooks property when it isforwardReformemocomponent (meowtec in #20626)- Ensure
sync-xhris allowed before reload and profile (ChrisDobby in #20879) - Bump electron version from 9.1.0 to 11.1.0 for darwin-arm64 builds (jaiwanth-v in #20496)
- Fixed primitive hook badge colors for light theme (bvaughn in #21034)
- Increased minimum Chrome/Firefox versions from 51/54 to 60/55 to reduce polyfill code. (bvaughn in #21185)
- Fix can't expand prop value in some scenario (iChenLei in #20534)
- Flush updated passive warning/error info after delay (bvaughn in #20931)
- Patch console methods even when only show-inline-warnings/errors enabled (bvaughn in #20688)
- React Native fixes for new inline errors feature (bvaughn in #20502)
- Fixed invalid work tag constants that affected a certain range of React versions (bvaughn in #20362)
Features
- Improve Profiler commit-selector UX (bvaughn in #20943)
- Swap
logwithcbrtfor commit bar height (bvaughn in #20952) - Integrate with new experimental React Suspense features to improve props loading and inspection UX (bvaughn in #20548, #20789, #20458)
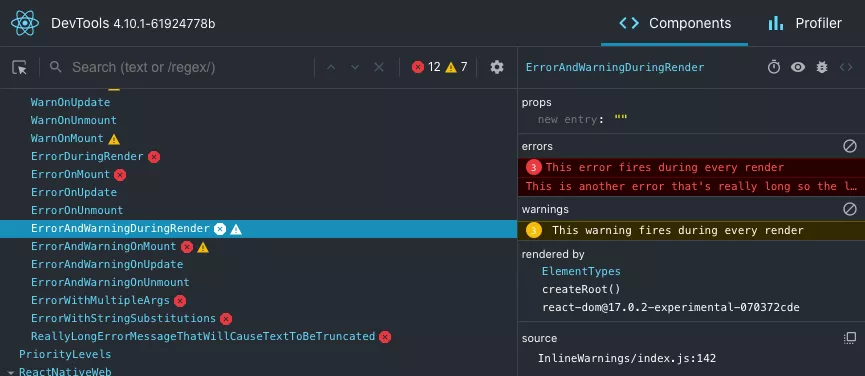
- Expose DEV-mode warnings in devtools UI (eps1lon in #20463)
- Display shortcuts for prev/next search result (eps1lon in #20470)
- Increase the clickable area of the prop value (TryingToImprove in #20428)
Experimental features
The following features are only enabled when used with (experimental) builds of React:
- Shows which fibers scheduled the current update (bvaughn in #21171)
- Add commit and post-commit durations to Profiler UI (bvaughn in #20984, #21183)
- Show which hooks (indices) changed when profiling (bvaughn in #20998)
Improve Profiler commit-selector UX


Expose DEV-mode warnings in devtools UI
Shows which fibers scheduled the current update
Add commit and post-commit durations to Profiler UI

Show which hooks (indices) changed when profiling
4.10.4
May 20, 2021
Bugfix
4.10.3
April 27, 2021
Bugfix
- Replaced Facebook-internal fburl.com link with public fb.me link for Bridge protocol mismatch info page (bvaughn in #21344)
4.10.2
April 27, 2021
Features
- Added Bridge protocol check and warning dialog if embedded DevTools backend is incompatible with DevTools UI (bvaughn in #21344)
4.10.1
November 12, 2020
Bugfix
4.10.0
November 12, 2020
Features
Bugfix
- Fix error loading source maps for devtools extension (sytranvn in #20079)
- Remove css-sourcemap for
react-devtools-inline(sean9keenan in #20170) - Decrease NPM update notification/prompt for standalone DevTools (recurx in #20078)
4.9.0
October 19, 2020
Features
- Improved DevTools editing interface (bvaughn in #19774)
- Add ⎇ + arrow key navigation (bvaughn in #19741)
- Add checkbox toggle for boolean values (mdaj06 in #19714)
- Show symbols used as keys in state (omarsy in #19786)
- Add new (unstable)
SuspenseListcomponent type (bpernick in #19684)
Bugfix
- Show proper icon/tooltip for restricted browser pages (sktguha in #20023)
- Fix emoji character shown in Chrome developer tools panel (bvaughn in #19603)
- Don't open two tabs in Firefox when clicking on troubleshooting instructions (unbyte in #19632)
- Support inner component
_debugOwnerin memo (bvaughn in #19556) - Proxied methods should be safely dehydrated for display (@pfongkye in b6e1d08
- Property list values should show whitespace (sammarks in #19640)
- Fix crash when inspecting document.all (omarsy in #19619)
- Don't call generators during inspection since they may be stateful (todortotev in #19831)
- Fix bad null check in DevTools highlight code (bvaughn in #20010)
- Handled a missing suspense fiber when suspense is filtered on the profiler (IDrissAitHafid in #ISSUE)
- Fixed unfound node error when Suspense is filtered (IDrissAitHafid in #20019)
- Always overrides the dispatcher when shallow rendering (bvaughn in #20011)
- Frevent phishing attacks (iamwilson in #19934)
Other
- Enable source maps for DevTools production builds (jpribyl in #19773)
- Drop support for IE 11 (bvaughn in #19875)
- Remove ReactJS.org version check "cheat" (sktguha in #19939)
- Update outdated links and fix two broken links (sktguha in #19985)
- Remove support for deprecated/unreleased React Flare event system (trueadm in #19520)
Improved DevTools editing interface
Improved parsing
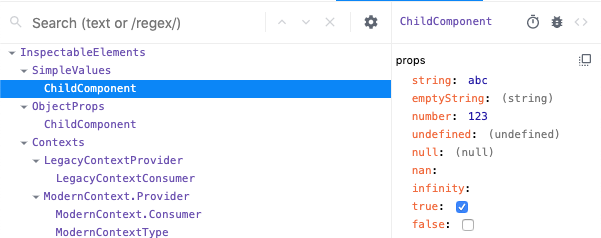
Value parsing logic has been relaxed so as to no longer require quotes around strings or double quotes:
Modifying arrays
New values can be added to array props/state/hooks now. Existing values can also be deleted:

Modifying objects
New keys can be added to object props/state/hooks now. Existing keys can be renamed or deleted entirely:
4.8.2
July 15, 2020
Bugfix
- Fix broken
Suspenseheuristic (bvaughn in #19373) - Fixed error with standalone in HTTPS mode (b-ponomarenko in #19336)
- Disable DevTools minification (bvaughn in #19369)
4.8.1
July 10, 2020
Bugfix
4.8.0
July 9, 2020
Features
- Add SSL support to React devtools standalone (ittaibaratz in #19191)
- New break-on-warning feature (off by default) (bvaughn in #19048)
Bugfix
- Updates Electron version for react-devtools to pull in several security fixes (gsimone in #19280)
- Remove unnecessary tag end from CommitRanked view (finico in #19195)
- Shutdown DevTools Bridge synchronously when unmounting (bvaughn in #19180)
4.7.0
May 18, 2020
Features
- Improved appended component stacks for third party warnings to be more like native (bvaughn in #18656)
- Improve inline search results by highlighting match on HOC badge (bl00mber in #18802)
- Add key badge to inspected element in right hand pane ([karlhorky]](https://github.com/karlhorky) in #18737)
- Improve Profiler snapshot selector drag-and-drop UX (bl00mber in #18852)
- Profiler tooltip now includes self duration to make it easier to scan times without requiring selection (bvaughn in #18510)
- Rendered by list also now highlights native elements on hover (hristo-kanchev in #18479)
- Add in-page highlighting for mouse-over interactions in Profiler (bl00mber in #18745)
Bugfix
- Fix Profiler bug "Could not find commit data for root" by resetting selected node on root change (bl00mber in #18880)
- Add
importedflag to Profiling data to more reliably differentiate between imported and session data (bl00mber in #18913) - Disable Profiler filtering to avoid edge case runtime error "Cannot read property 'duration' of undefined" (bvaughn in #18862)
- Fix Profiler bug "cannot read property 'memoizedState' of null" (bvaughn in #18522)
- Whitespace search results highlighting bug fix (bvaughn in #18527)
- Improved confusing Profiler tooltip text for components that did not render (bvaughn in #18523)
- Fix edge case performance issue when highlight elements enabled (Faelivrinx in #18498)
- Disabled Webpack auto polyfill for
setImmediate(bvaughn in #18860) - Fix mouse interactions for standalone DevTools on Linux (bl00mber in #18772)
4.6.0
March 26, 2020
Features
Bugfix
- Improve display of complex values for
useDebugValue(eps1lon in #18070) - Fix minor CSS layout issue that broke Profiler commit selector UI (bvaughn in #18286)
- Inlined DevTools event emitter implementation to fix a source of Profiler bugs (bvaughn in #18378)
Cleanup
4.5.0
March 3, 2020
Features
- Improve function props display for inspected elements (bvaughn in #17789)
- Re-enabled context menu for Firefox extension (bvaughn in #17838)
- Apply changes to props/state/hooks on blur (rather than on ENTER) (muratcatal in #17062)
- Add info tooltip to nodes in Profiler (M-Izadmehr in #18048)
- Added resize support to Components panel (hristo-kanchev in #18046)
Bugfix
- Improve how empty commits are filtered (nutboltu in #17931)
- BigInt serialize issue in devtools copy to clipboard (bvaughn in #17771)
- Renamed "backend.js" to "react_devtools_backend.js" to reduce potential confusion from profiling (bvaughn in #17790)
- Update root styles to prevent
box-sizingstyle from leaking outside of inline target (GasimGasimzada in #17775) - Fix "Cannot read property 'sub' of undefined" error when navigating to plain-text pages (wfnuser in #17848)
- Fix potential error with composite hooks during shallow re-rendering (bvaughn in #18130)
- Scope dev tools wildcard styles within DevTools CSS class (@GasimGasimzada in 9cc094a)
Info summary tooltips


Components panel resize


4.4.0
January 3, 2020
Features
- Re-enabled "copy" prop/state/hooks context menu option for Firefox (bvaughn,rpl in #17740)
- Shift+Enter focuses previous search result in Components tree (Bo-Duke in #17005)
- Properly display formatted
RegExpvalues in props/state panel(bvaughn in #17690) - Profiler commit selector wraps around for easier navigation of large profiles (bvaughn in #17760)
Bugfix
- Check
document.contentTypebefore injecting hook to avoid breaking XML file syntax highlighting in Firefox (bvaughn in #17739) - Fix standalone UI not responding to mouse interactions due to
webkit-app-regionstyle (cwatson88 in #17584) - Support inspecting object values with null protos (bvaughn in #17757)
- Support inspecting values that have overridden
hasOwnPropertyattribute (bvaughn in #17768) - Fixed regression that made Profiler "Could not find node…" error happen more frequently (bvaughn in #17759)
4.3.0
December 20, 2019
Features
- Show component location for selected element in bottom/right panel (bvaughn in #17567)
- Improved inspected element values with inline previews (bvaughn in #17579)
- Improved selection and toggling for inspected element panel (bvaughn in #17588)
- Copy context menu for inspecting and copying props/state/hooks/context values (bvaughn in #17608)
Bug fixes
- Fix serialization for
BigInttype so that it does not break inspection panel. (nutboltu in #17233) - Fix display name logic for
forwardRefs that usedisplayNameproperty (zthxxx in #17613)
4.2.1
November 27, 2019
Bug fixes
- Profiler automatically filters certain types of empty (no work) commits. (bvaughn in #17253)
- Fix memoized components showing as "Anonymous" in Components tab. (wsmd in #17274)
- Edge-case bugfix for non-string element keys. (bvaughn in #17164)
4.2.0
October 3, 2019
Features
- "Highlight updates" feature added for browser extensions and
react-devtools-inlineNPM package. (bvaughn in #16989)
4.1.3
September 30, 2019
Bug fixes
- Fixed regression where DevTools wouldn't properly connect with apps when using the
file://protocol. (linshunghuang in #16953)
4.1.2
September 27, 2019
Bug fixes
4.1.1
September 26, 2019
Bug fixes
- Fixed bug where Components panel was always empty for certain users. (linshunghuang in #16900)
- Fixed regression in DevTools editable hooks interface that caused primitive values to be shown as
undefined. (bvaughn in #16867) - Fixed bug where DevTools showed stale values in props/state/hooks editing interface. (bvaughn in #16878)
- Show unsupported version dialog with downgrade instructions. (bvaughn in #16897)
4.1.0
September 19, 2019
Features
- Props/state editor supports adding new values and changing value types. (hristo-kanchev in #16700)
Bug fixes
- Profiler correctly saves/exports profiling data in Firefox now. (hristo-kanchev in #16612)
- Class components now show "legacy context" header (rather than "context") for legacy API. (hristo-kanchev in #16617)
- Show component source button ("<>") now highlights the
rendermethod for class components. (theKashey in #16759) - Bugfix for components with non-standard object values for
function.name. (LetItRock in #16798)
4.0.6
August 26, 2019
Bug fixes
- Remove ⚛️ emoji prefix from Firefox extension tab labels
- Standalone polyfills
Symbolusage
4.0.5
August 19, 2019
Bug fixes
- Props, state, and context values are alpha sorted.
- Standalone DevTools properly serves backend script over localhost:8097
4.0.4
August 18, 2019
Bug fixes
- Bugfix for potential error if a min-duration commit filter is applied after selecting a fiber in the Profiler UI.
4.0.3
August 17, 2019
Bug fixes
- ES6
MapandSet, typed arrays, and other unserializable types (e.g. Immutable JS) can now be inspected. - Empty objects and arrays now display an "(empty)" label to the right to reduce confusion.
- Components that use only the
useContexthook now properly display hooks values in side panel. - Style editor now supports single quotes around string values (e.g. both
"red"and'red'). - Fixed edge case bug that prevented profiling when both React v16 and v15 were present on a page.
4.0.2
August 15, 2019
Permissions cleanup
- Removed unnecessary
webNavigationpermission from Chrome and Firefox extensions.
4.0.1
August 15, 2019
Permissions cleanup
- Removed unnecessary
<all_urls>,background, andtabspermissions from Chrome and Firefox extensions.
4.0.0
August 15, 2019
General changes
Improved performance
The legacy DevTools extension used to add significant performance overhead, making it unusable for some larger React applications. That overhead has been effectively eliminated in version 4.
Learn more about the performance optimizations that made this possible.
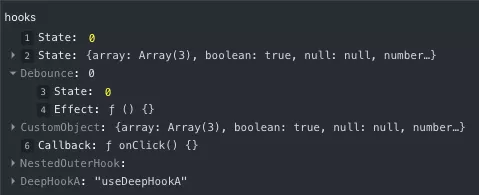
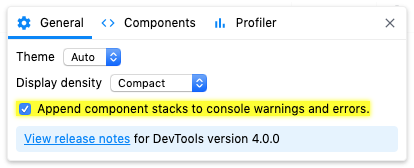
Component stacks
React component authors have often requested a way to log warnings that include the React "component stack". DevTools now provides an option to automatically append this information to warnings (console.warn) and errors (console.error).

It can be disabled in the general settings panel:
Components tree changes
Component filters
Large component trees can sometimes be hard to navigate. DevTools now provides a way to filter components so that you can hide ones you're not interested in seeing.
Host nodes (e.g. HTML <div>, React Native View) are now hidden by default, but you can see them by disabling that filter.
Filter preferences are remembered between sessions.
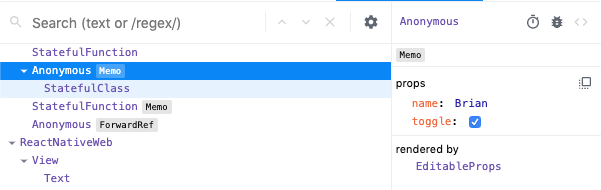
No more inline props
Components in the tree no longer show inline props. This was done to make DevTools faster and to make it easier to browse larger component trees.
You can view a component's props, state, and hooks by selecting it:
"Rendered by" list
In React, an element's "owner" refers to the thing that rendered it. Sometimes an element's parent is also its owner, but usually they're different. This distinction is important because props come from owners.
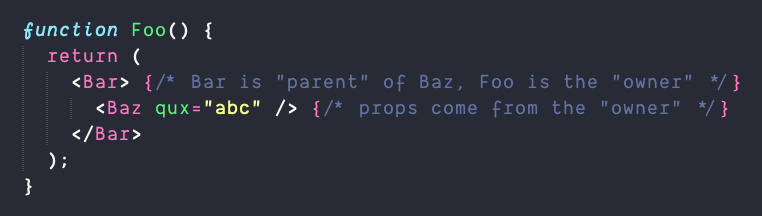
When you are debugging an unexpected prop value, you can save time if you skip over the parents.
DevTools v4 adds a new "rendered by" list in the right hand pane that allows you to quickly step through the list of owners to speed up your debugging.
Owners tree
The inverse of the "rendered by" list is called the "owners tree". It is the list of things rendered by a particular component- (the things it "owns"). This view is kind of like looking at the source of the component's render method, and can be a helpful way to explore large, unfamiliar React applications.
Double click a component to view the owners tree and click the "x" button to return to the full component tree:
No more horizontal scrolling
Deeply nested components used to require both vertical and horizontal scrolling to see, making it easy to "get lost" within large component trees. DevTools now dynamically adjusts nesting indentation to eliminate horizontal scrolling.
Improved hooks support
Hooks now have the same level of support as props and state: values can be edited, arrays and objects can be drilled into, etc.
Improved search UX
Legacy DevTools search filtered the components tree to show matching nodes as roots. This made the overall structure of the application harder to reason about, because it displayed ancestors as siblings.
Search results are now shown inline similar to the browser's find-in-page search.
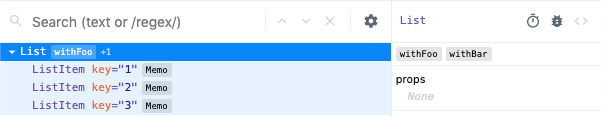
Higher order components
Higher order components (or HOCs) often provide a custom displayName following a convention of withHOC(InnerComponentName) in order to make it easier to identify components in React warnings and in DevTools.
The new Components tree formats these HOC names (along with several built-in utilities like React.memo and React.forwardRef) as a special badge to the right of the decorated component name.
Components decorated with multiple HOCs show the topmost badge and a count. Selecting the component shows all of the HOCs badges in the properties panel.
Restoring selection between reloads
DevTools now attempts to restore the previously selected element when you reload the page.

Suspense toggle
React's experimental Suspense API lets components "wait" for something before rendering. <Suspense> components can be used to specify loading states when components deeper in the tree are waiting to render.
DevTools lets you test these loading states with a new toggle:
Profiler changes
Reload and profile
The profiler is a powerful tool for performance tuning React components. Legacy DevTools supported profiling, but only after it detected a profiling-capable version of React. Because of this there was no way to profile the initial mount (one of the most performance sensitive parts) of an application.
This feature is now supported with a "reload and profile" action:
Import/export
Profiler data can now be exported and shared with other developers to enable easier collaboration.
Exports include all commits, timings, interactions, etc.
"Why did this render?"
"Why did this render?" is a common question when profiling. The profiler now helps answer this question by recording which props and state change between renders.
Because this feature adds a small amount of overhead, it can be disabled in the profiler settings panel.
Component renders list
The profiler now displays a list of each time the selected component rendered during a profiling session, along with the duration of each render. This list can be used to quickly jump between commits when analyzing the performance of a specific component.